 Buy Crypto
- Markets
 Futures
- Spot
- Copy Trade
- Earn
- More
Trump Takes Over the Fed, Impact on Bitcoin in the Coming Months

Tonight will see the most anticipated interest rate cut decision by the Federal Reserve this year.
The market is widely betting on a rate cut almost being a done deal. However, what will truly determine the future trend of risk assets in the coming months is not just another 25-basis-point cut, but a more critical variable: whether the Fed will inject liquidity back into the market.
Therefore, this time, Wall Street is not focused on the interest rate but on the balance sheet.
According to expectations from institutions such as Bank of America, Vanguard, PineBridge, and others, the Fed may announce this week that it will start a $45 billion per month short-term debt purchase program from January next year as part of a new round of "reserve management operations." In other words, this means that the Fed may be quietly restarting an era of "tacit balance sheet expansion," allowing the market to enter into liquidity easing ahead of the rate cut.
But what truly has the market on edge is the backdrop against which this is playing out—the U.S. is entering an unprecedented period of monetary power reshuffling.
Trump is taking over the Fed in a way far faster, deeper, and more thorough than anyone had anticipated. It's not just about replacing the chairman but redefining the power boundaries of the monetary system, reclaiming control of long-term rates, liquidity, and the balance sheet from the Fed to the Treasury. The central bank independence, which has been considered a "sacred rule" for decades, is quietly being eroded.
This is also why from the Fed's rate cut expectations to ETF fund flows, from MicroStrategy to Tom Lee's contrarian position increase, all seemingly disparate events are actually converging on the same underlying logic: the U.S. is entering a "fiscally-led currency era."
And what impacts will this have on the crypto market?
MicroStrategies Power Up
Over the past two weeks, the entire market has been discussing one question: Will MicroStrategy be able to withstand this downturn? Bears have simulated various scenarios of this company "collapse."
But Saylor clearly doesn't think so.
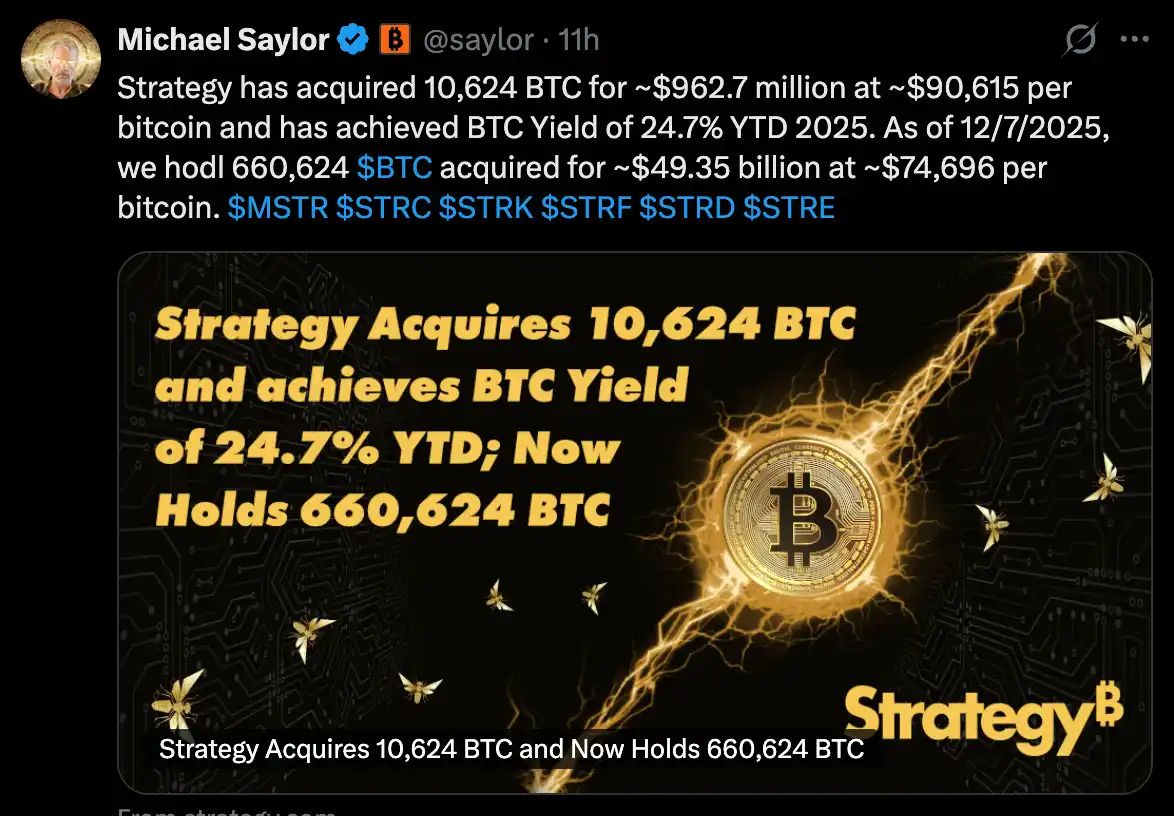
Last week, MicroStrategy increased its Bitcoin holdings by approximately $963 million, specifically 10,624 BTC. This was their largest purchase in the past few months, exceeding even the total accumulation of the last three months.
It's worth noting that the market had been speculating whether, as MicroStrategy's market NAV approached 1, the company would be forced to sell Bitcoin to avoid systemic risk. When the market NAV almost hit 1, instead of selling, they not only held but also doubled down on their position, and to such a large extent.
Meanwhile, on the ETH side, an equally exciting contrarian move unfolded. BitMine, under Tom Lee's leadership, managed to continue hitting the ATM even as the ETH price plummeted and the company's market value retraced by 60%. In a surprising turn of events, BitMine raised a large amount of cash and bought $4.29 billion worth of ETH in one go last week, increasing its holdings to a $12 billion scale.
Despite BMNR's stock price plummeting by over 60% from its peak, the team was still able to keep hitting the ATM (issuance mechanism) to raise money and continue buying more.
CoinDesk analyst James Van Straten was more direct in his assessment on X: "MSTR can raise $1 billion in a week, while back in 2020, it would take them four months to achieve the same scale. The exponential trend is still ongoing."
In terms of market capitalization impact, Tom Lee's actions are even "heavier" than Saylor's. Since BTC's market cap is five times that of ETH, Tom Lee's $4.29 billion buy order is equivalent to a "double impact" on Saylor's $1 billion BTC purchase in terms of weight.
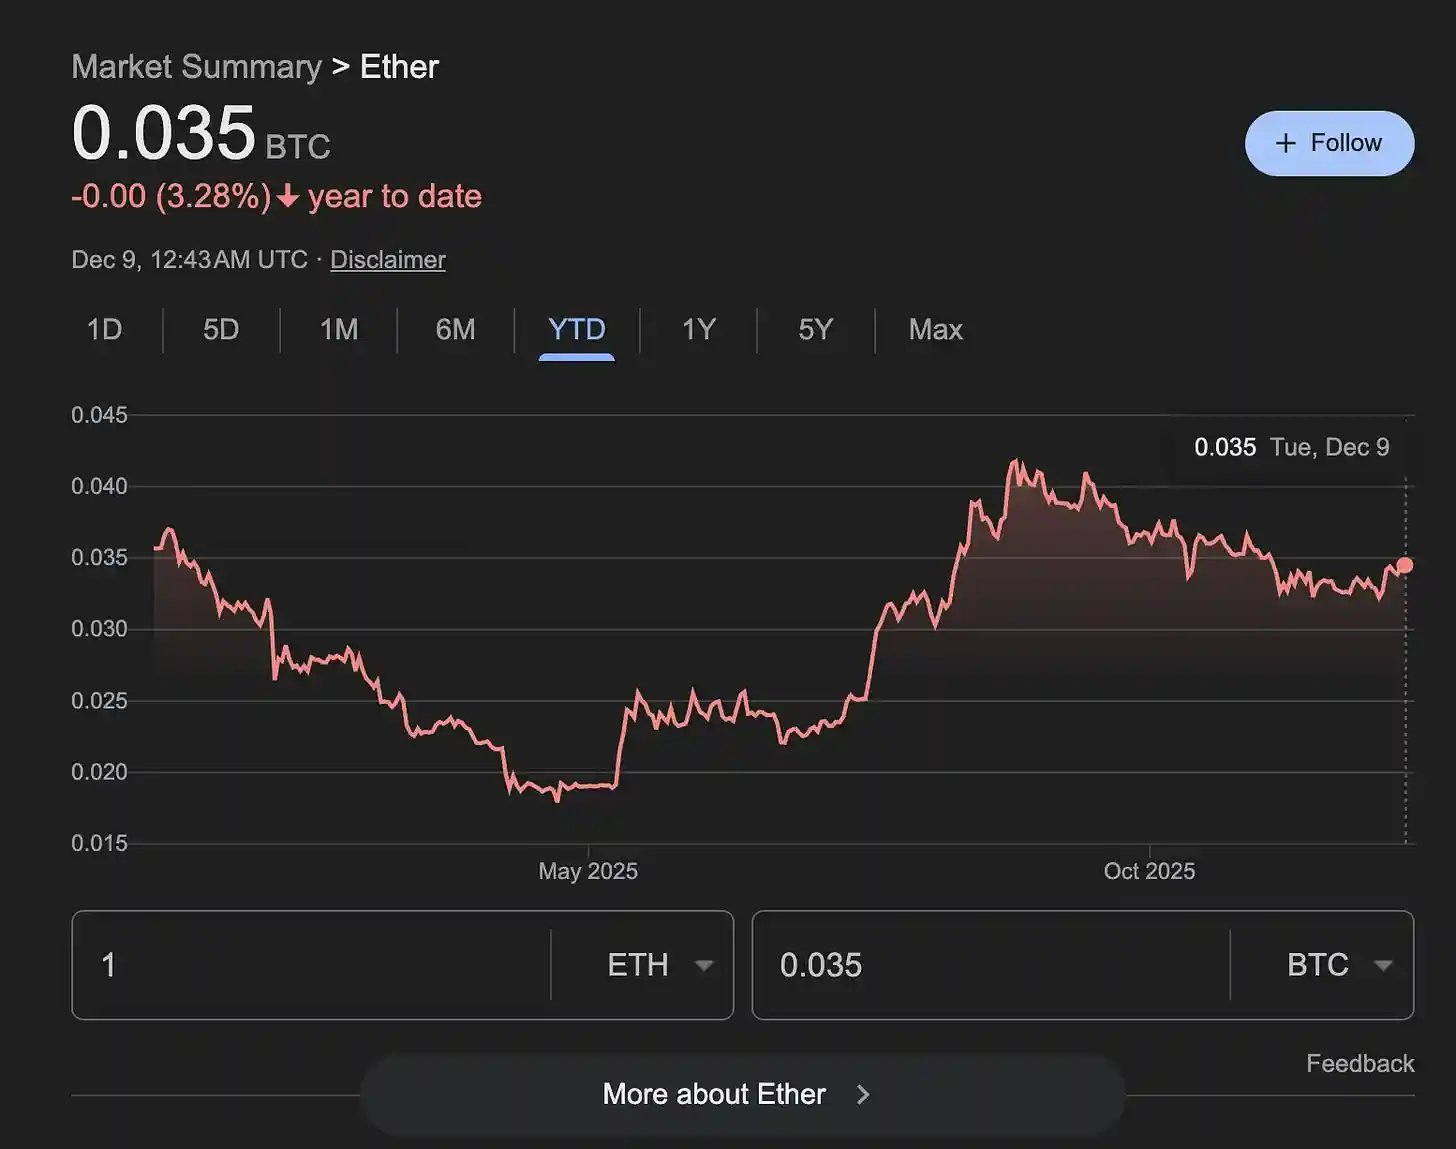
No wonder the ETH/BTC ratio has started to rebound, breaking free from a three-month downtrend. History has repeated itself countless times: whenever ETH takes the lead in warming up, the market enters a brief but intense "altcoin rebound window."
With $1 billion in cash on hand, BitMine is strategically positioned in the optimal cost averaging range where ETH has significantly dipped. In a market where funding is generally tight, having an institution that can continue to aggressively buy is inherently part of the price structure.
ETFs Are Not Fleeing, but Arbitrage Players Are Temporarily Withdrawing
At first glance, over the past two months, Bitcoin ETFs have seen outflows of nearly $4 billion, causing the price to drop from $125,000 to $80,000, leading the market to quickly draw a rough conclusion: institutions are pulling out, ETF investors are panicking, and the bull market structure is crumbling.
However, insights from Amberdata provide a completely different explanation.
These outflows are not due to "value investors fleeing," but rather to "leveraged arbitrage funds being forced to liquidate." The main source of this liquidation is a structured arbitrage strategy called "basis trade" falling apart. Funds originally earned a stable spread by "buying spot/shorting futures," but starting from October, the annualized basis dropped from 6.6% to 4.4%, spending 93% of the time below the breakeven point, turning the arbitrage into losses and forcing the strategy to unwind.
This triggered a "two-way action" of ETF outflows + futures unwinding.
In the traditional sense, a capitulation sell-off often occurs in an extreme emotional environment after a continuous downturn, where market panic reaches its peak, investors no longer attempt to set stop-loss orders, but instead completely abandon all positions. Its typical characteristics include: almost all issuers experiencing large-scale redemptions, a surge in trading volume, relentless sell-offs regardless of cost, and accompanying extreme sentiment indicators. However, this ETF outflow clearly does not fit this pattern. Despite an overall net outflow, the direction of funds is not consistent: for example, Fidelity's FBTC continued to experience continuous inflows throughout the period, while BlackRock's IBIT even absorbed some incremental funds during the most severe net outflow phase. This indicates that only a few issuers are truly withdrawing, rather than the entire institutional group.
More critical evidence comes from the distribution of outflows. From October 1 to November 26, over a 53-day period, Grayscale's funds contributed to over $9 billion in redemptions, accounting for 53% of the total outflows; 21Shares and Grayscale Mini followed closely, together representing nearly ninety percent of the redemption volume. In contrast, BlackRock and Fidelity—the most typical institutional allocation channels in the market—saw a net inflow overall. This is completely inconsistent with a true "panic institutional retreat" and instead appears more like some kind of "localized event."
So, which type of institutions are selling? The answer is: large funds engaging in basis arbitrage.
The so-called basis trade is essentially a direction-neutral arbitrage structure: funds buy spot Bitcoin (or ETF shares) while shorting futures to earn the contango yield. This is a low-risk, low-volatility strategy that attracts a large amount of institutional funds when the futures premium is reasonable and funding costs are manageable. However, this model relies on one premise: the futures price must consistently remain above the spot price, and the spread must be stable. Starting from October, this premise suddenly disappeared.
According to Amberdata, the 30-day annualized basis compressed from 6.63% to 4.46, with 93% of trading days below the 5% breakeven point required for arbitrage. This means these trades are no longer profitable, and may even start to incur losses, forcing funds to exit. The rapid collapse of the basis led to a "systemic unwinding" of these arbitrageurs: they had to sell off ETF holdings while buying back the futures they were previously short, to close this arbitrage trade.
This process is clearly visible from the market data. The open interest of Bitcoin perpetual contracts decreased by 37.7% during the same period, with a cumulative reduction of over $4.2 billion, and a correlation coefficient of 0.878 with the basis change, showing an almost synchronous movement. This "ETF sell-off + short cover" combination is the typical path for basis trade exit; the sudden amplification of ETF outflows is not price panic-driven but rather the inevitable result of the arbitrage mechanism's collapse.
In other words, the ETF outflows of the past two months look more like a "leverage unwinding event" rather than a "long-term institutional retreat." This was a highly professional, structured trading dismantling, rather than a panic sell-off driven by market sentiment.
More importantly, when these arbitrage positions were cleared, the remaining fund structure actually became healthier. Currently, ETF holdings remain at around a high of about 1.43 million bitcoins, with the majority of shares coming from allocation-focused institutions rather than short-term funds chasing spreads. As leveraged hedge positions were removed, the overall market leverage ratio decreased, reducing volatility sources. Price action will be more driven by "genuine buying and selling pressure" rather than being hijacked by forced technical maneuvers.
Amberdata's Head of Research, Marshall, describes this as a "market reset": after the retreat of arbitrage positions, the additional funds in ETFs are more directional and long-term in nature, reducing structural market noise. Subsequent trends will more reflect real demand. This means that although it may seem like a $4 billion outflow on the surface, it may not necessarily be a bad thing for the market itself. On the contrary, it could also lay the foundation for the next wave of healthier growth.
If Saylor, Tom Lee, and the ETF funds represent a micro perspective, the macro-level changes are deeper and more drastic. Will the Christmas market rally come? To find the answer, we may need to look at the macro level again.
Trump's "Takeover" of the Currency System
For decades, the independence of the Federal Reserve has been seen as a "sacred rule." Monetary power belongs to the central bank, not the White House.
However, Trump clearly disagrees with this.
Increasing signs indicate that the Trump team is taking over the Federal Reserve in a way that is far faster and more thorough than the market expected. It's not just symbolically "changing to a more hawkish chairman," but rather a comprehensive rewriting of the power distribution between the Federal Reserve and the Treasury Department, changing the balance sheet mechanism, and redefining the pricing of the interest rate curve.
Trump is attempting to reconstruct the entire currency system.
Former New York Fed trading desk head Joseph Wang (a long-time researcher of the Fed's operational system) has also made it clear that "the market significantly underestimates Trump's determination to control the Fed, and such changes could push the market into a higher-risk, higher-volatility phase."
From personnel arrangements, policy direction to technical details, we can see very clear traces.
The most tangible evidence comes from personnel arrangements. The Trump camp has already put several key figures in core positions, including Kevin Hassett (former White House economic advisor), James Bessent (key decision-maker at the Treasury Department), Dino Miran (financial policy advisor), and Kevin Warsh (former Federal Reserve governor). These people have a common trait: they are not traditional "central bank proponents" and do not advocate central bank independence. Their goal is very clear: to weaken the Fed's monopoly on interest rates, long-term funding costs, and systemic liquidity, and to return more currency power to the Treasury Department.
The most symbolic point is: It was widely believed that Bessent, who was considered the most suitable candidate to take over as Federal Reserve Chair, ultimately chose to stay at the Treasury Department. The reason is simple: in the new power structure, the Treasury Department's position is more influential in shaping the rules of the game than the Federal Reserve Chair.
Another important clue comes from the changing term premium.
For the average investor, this indicator may be somewhat unfamiliar, but it is actually the most direct signal of the market's judgment on "who is controlling long-term interest rates." Recently, the spread between 12-month U.S. Treasuries and 10-year Treasuries once again approached a multi-month high. This upward trend is not due to a strengthening economy or rising inflation but rather the market reassessing: in the future, it may not be the Federal Reserve but the Treasury Department that determines long-term interest rates.

The yields on 10-year and 12-month Treasury bonds are continuing to decline, indicating a strong market bet that the Federal Reserve will cut interest rates, and the pace will be faster and more aggressive than previously expected.

The SOFR (Secured Overnight Financing Rate) experienced a cliff-like drop in September, indicating a sudden collapse in the U.S. money market interest rates and signaling a significant loosening of the Federal Reserve's policy rate system.
The initial increase in the spread was because the market believed that Trump would cause the economy to "overheat" after taking office; later, when tariffs and large-scale fiscal stimulus were absorbed by the market, the spread quickly fell back. Now, as the spread rises again, it no longer reflects growth expectations but rather uncertainty about the Hassett-Bessent system: if in the future the Treasury Department controls the yield curve through adjustments in debt duration, increased short-term debt issuance, and reducing long-term debt, then traditional methods of assessing long-term rates will become completely ineffective.
A more subtle but critical piece of evidence lies in the balance sheet system. The Trump team has frequently criticized the current "ample reserve regime" (where the Federal Reserve expands its balance sheet and provides reserves to the banking system, making the financial system heavily reliant on the central bank). However, at the same time, they are keenly aware that the current reserves are already tight, and the system actually needs a balance sheet expansion to maintain stability.
This contradiction of "opposing balance sheet expansion but being forced to expand" is actually a strategy. They use this as a reason to question the Federal Reserve's institutional framework, advocating for more monetary power to be transferred back to the Treasury Department. In other words, they are not seeking an immediate balance sheet reduction but are using the "balance sheet dispute" as a breakthrough to weaken the Federal Reserve's institutional position.
If we string these actions together, we see a very clear direction: term premium compression, U.S. Treasury duration shortening, the gradual loss of independence of long-term rates; banks may be required to hold more U.S. Treasuries; government-sponsored entities may be encouraged to leverage up to buy mortgage-backed securities; the Treasury Department may influence the entire yield structure by increasing short-term debt issuance. Prices previously determined by the Fed will gradually be replaced by fiscal tools.
The resulting outcome may be: gold entering a long-term uptrend, stocks maintaining a slow melt-up structure after volatility, and liquidity gradually improving due to fiscal expansion and repurchase mechanisms. The market may appear chaotic in the short term, but this is only because the boundaries of the monetary system's power are being redrawn.
As for Bitcoin, the most concerning asset in the crypto market, it finds itself on the edge of this structural shift, not the most direct beneficiary, nor the main battleground. On the positive side, improved liquidity will provide a floor for Bitcoin prices; however, looking at the longer-term trend in the next 1-2 years, it still needs to go through a period of further accumulation, waiting for the new monetary system framework to truly clarify.
The U.S. is transitioning from the "Central Bank Dominated Era" to the "Fiscal Dominated Era."
In this new framework, long-term rates may no longer be determined by the Fed, liquidity will come more from the Treasury, the Fed's independence will be weakened, market volatility will be greater, and risk assets will also face a completely different pricing system.
As the underlying system is being rewritten, all prices will behave more 'illogically' than usual. But this is a necessary stage of the old order loosening and the new order arriving.
The market trends in the coming months are likely to emerge in this chaos.
You may also like

Is XRP a Good Investment in 2026? Why Is It Stuck at $1.45
XRP is up 6.7% this week, but exchange reserves remain high. Is a volatility spike imminent? We analyze price trend, ETF inflows, whale activity, and regulatory catalysts to answer: will XRP go up, why is XRP dropping, and is XRP a good investment right now?
TL; DR
What is XRP: XRP is a digital asset built for fast, low-cost international payments. It runs on the XRP Ledger and is used by Ripple for its On-Demand Liquidity (ODL) service. Unlike Bitcoin, XRP settles transactions in 3-5 seconds with near-zero fees.Why is XRP Dropping: XRP is not actively dropping, but it is struggling to rise. On the monthly chart, XRP has seen six consecutive months of decline. Currently, the price faces an additional supply wall at $1.45. About 1.24 billion XRP were bought in that range, and those holders sell when the price approaches, creating selling pressure that prevents a recovery.Will XRP Go Up: Potentially yes. XRP is trading near $1.43 and showing its best weekly performance since September 2025. If the price breaks above the $1.45 resistance, analysts expect a move toward $1.90, supported by strong institutional demand.Is XRP a Good Investment: The answer is not simple. Short-term traders may see opportunity in the coming volatility spike. Long-term investors face a bigger question that depends on one key regulatory event. However, the data reveals a surprising signal that most retail buyers are missing right now. To understand whether XRP is a smart buy or a trap at $1.43, you will need to read the full analysis below.What is XRP? A Digital Asset for Global SettlementBefore analyzing the charts, it is crucial to understand the asset in question. What is XRP? Unlike Bitcoin, which was designed as a decentralized digital gold, XRP operates on the XRP Ledger (XRPL). It was created to facilitate fast, low-cost international payments. Traditional bank transfers take days and incur high fees. XRP transactions settle in 3-5 seconds, costing fractions of a penny.
Ripple, the company associated with XRP, uses this asset for its "On-Demand Liquidity" (ODL) service. Banks and financial institutions use ODL to source liquidity during cross-border transactions without pre-funding accounts. This utility is the primary driver for institutional interest. Recently, the network hit a milestone of over 8 million active wallets, signaling growing usage despite recent price stagnation . Furthermore, Ripple is proactively preparing for the future, releasing a four-stage roadmap to make the XRPL "quantum-resistant," aiming to secure the ledger against future quantum computing threats by 2028 .
XRP Price Analysis: The Battle for $1.45The XRP price trend over the last month tells a story of exhaustion followed by cautious recovery. On the monthly chart, XRP experienced six consecutive months of decline. However, April shows signs of a bottoming process. Weekly charts reinforce this view: after four weeks of lower closes, the last two weeks have seen small rebounds.
According to data from April 22, 2026, XRP is trading at approximately $1.44. Over the last seven days, XRP has outperformed both Bitcoin and Ethereum, rising 6.7% while the broader market rose only 3.2%. Spot trading volume surged 23% to $3.79 billion, and derivative markets saw $40 billion in futures volume on a single day.
Despite this, the price remains 60% below its July 2025 high of $3.65. The current technical picture shows a "low volatility grind" higher. The 20-day EMA is at $1.3924, and the 50-day EMA is at $1.4119, both acting as support . However, the immediate hurdle is the $1.45 resistance level. This price point has rejected every rally attempt in 2026.
Why is XRP Dropping? And Will XRP Go Up?The primary reason for the recent "drop" (or lack of upward momentum) is not active selling, but rather the "supply wall." Data indicates that roughly 1.24 billion XRP tokens were purchased by investors in the $1.45 to $1.47 range. These investors have been waiting months to "break even." Every time the price approaches $1.45, these holders sell to exit their positions, creating a massive wall that retail buying cannot easily absorb.
However, the underlying momentum is shifting. Analysts suggest a xrp volatility spike imminent because the absorption capacity of buyers is increasing. Historically, when exchange reserves are high but the price refuses to drop significantly, it signals that buyers are absorbing the supply. The price has held above $1.39 despite the overhang, which is a sign of relative strength.
So, will XRP go up? Yes, potentially. But it needs a catalyst, if the price closes a daily candle above $1.45. If that happens, the next targets are $1.60 to $1.65, and eventually $1.90 .
XRP Exchange Netflow and XRP ETF Netflow: A Tale of Two MarketsThe current market dynamic is best understood by looking at two opposing data streams: XRP Exchange netflow and XRP ETF flows.
Exchange Dynamics (Retail / Whales):
Data shows a complex pattern of "large inflows and increasing reserves." Recently, a Ripple-associated wallet moved 75 million XRP (approx. $108 million) to Coinbase. This initially looks like a dump, but context matters. These transfers are likely to provide liquidity for Ripple’s ODL business, not necessarily spot market selling. However, the result is that exchange reserves have climbed to 2.76 billion XRP .
The Good News: While reserves are high, the rate of increase is slowing. Specifically, "whale" transfers to exchanges have dropped 98% from their April 11 peak. The Binance reserve has slightly decreased from 27.7 to 27.6 billion. The aggressive selling from large holders appears to have stopped.
Institutional Dynamics (ETF):
While whales were sending coins to exchanges, institutions were buying XRP ETF products. XRP ETF net flow is strongly positive.
US-listed XRP ETFs recorded four consecutive days of inflows totaling $38.86 million recently .The weekly inflow for mid-April hit $119.6 million, a multi-month high .Cumulative net inflows stand at $12.8 billion, with Assets Under Management (AUM) at roughly $10.8 billion.Analyzing the Divergence: Why Both Flows Are PositiveIt seems contradictory that exchange reserves are high (suggesting selling) while ETFs are buying (suggesting buying). However, this phenomenon reveals the current market structure.
Different Investor Profiles: The exchange inflows likely come from short-term traders, market makers, or Ripple itself providing ODL liquidity. These are "hot" coins ready to be sold. The ETF inflows represent "sticky" capital. Institutions buying ETFs are typically long-term holders (LTHs) or asset managers who do not day-trade. They are removing liquidity from the spot market by buying through custodians.The "De-risking" Trade: Sophisticated funds might be engaging in basis trading. They buy the ETF (taking a long position) while simultaneously shorting XRP futures or selling spot inventory to capture the funding rate. This keeps the price stable while volume increases.Absorption: The most likely scenario is that the market is simply absorbing the excess supply. The fact that the price is stable ($1.43) and not collapsing to $1.20 despite 2.76 billion coins sitting on exchanges is a massive win for the bulls. The ETF inflows are acting as a sponge, soaking up the selling pressure from the ODL wallets.The Regulatory Catalyst: The SEC and the CLARITY ActFundamentally, the recent price action cannot be separated from regulation. For years, the primary answer was the SEC lawsuit. That narrative is dying.
Ripple CEO Brad Garlinghouse recently praised SEC Chair Paul Atkins as "a breath of fresh air and sanity" . This regulatory thaw is critical. The SEC is reportedly considering dropping the long-standing lawsuit, and five XRP ETF applications are awaiting review.
The major catalyst on the horizon is the CLARITY Act. A Senate markup is expected before the end of April. Standard Chartered analysts project that if the bill advances, it could unlock $4 to $8 billion in institutional flows . Polymarket gives the bill a 60-66% chance of passing in 2026. If the CLARITY Act classifies XRP as a non-security (commodity), the institutional floodgates will open, likely overwhelming the $1.45 supply wall instantly.
Is XRP a Good Investment in 2026?Given all this data, is XRP a good investment? The answer depends entirely on your risk tolerance and time horizon.
The Bull Case (Why it is a good investment): The risk/reward ratio is asymmetrical to the upside. The price is near multi-year lows relative to its utility. Whale selling has stopped, ETF demand is rising, and the network is expanding (8 million wallets, quantum resistance roadmap). If the CLARITY Act passes, XRP could realistically trade between $1.60 and $1.80 in the short term, with a potential run to $3.00+ if the lawsuit is officially dropped.The Risk Case (Why it is NOT a good investment): There is a clear resistance wall at $1.45. If the CLARITY Act fails or is delayed past May (due to midterm election dynamics), the "buy the rumor, sell the news" dynamic could reverse. If the price fails to break $1.45 and loses support at $1.33, a drop back to $1.15 is technically possible .Verdict: XRP is a speculative buy for traders looking for a volatility spike. It is a hold for current investors. For new investors, it is only a good investment if you believe in regulatory clarity within the next 30 days. Technically, waiting for a confirmed break above $1.55 (to avoid the fakeout) is safer than buying at $1.43.
FAQQ: Will XRP go up if the CLARITY Act passes?
A: Yes, historically. Analysts predict that if the CLARITY Act passes, signaling that XRP is a commodity, it would remove the regulatory overhang. This could trigger a surge in institutional buying, pushing the price from the current $1.43 range to test the $1.80 - $2.00 resistance levels quickly.
Q: Why is XRP dropping when Bitcoin is going up?
A: XRP has specific supply dynamics. Unlike Bitcoin, which has a fixed supply issuance, XRP faces periodic sell-pressure from Ripple's treasury wallets used to fund ODL (liquidity) services. Additionally, the $1.45 "break-even" wall causes XRP to drop relative to BTC when short-term traders exit.
Q: Is a volatility spike imminent for XRP?
A: Yes. The Bollinger Bands on the daily chart are squeezing. The price is stuck between support at $1.33 and resistance at $1.45. Historically, when XRP volume surges 23% in a week (as it did on April 21), it precedes a violent move. The direction depends on whether the $1.45 resistance breaks.
Q: What is the XRP ETF netflow status?
A: As of late April 2026, XRP ETFs are seeing positive netflows. The US ETFs recorded a single week inflow of $119.6 million in mid-April. Cumulative inflows are strong at $12.8 billion, indicating that institutions are accumulating during this dip, which is a long-term bullish signal for price stabilization.
Q: Is XRP a good investment for beginners?
A: XRP is less volatile than "meme coins" but more volatile than Bitcoin. For beginners, it is a moderate-risk investment. Its value is tied to real utility (bank payments). However, beginners should wait to see if the price can close a weekly candle above $1.55 before entering, to avoid buying into the current resistance wall.
Disclaimer: None of the information in this article constitutes, or is intended to constitute, investment advice. Trading cryptocurrencies carries a high level of risk and may not be suitable for all investors. Always do your own research.
About WEEXFounded in 2018, WEEX has developed into a global crypto exchange with over 6.2 million users across more than 150 countries. The platform emphasizes security, liquidity, and usability, providing over 1,200 spot trading pairs and offering up to 400x leverage in crypto futures trading. In addition to the traditional spot and derivatives markets, WEEX is expanding rapidly in the AI era — delivering real-time AI news, empowering users with AI trading tools, and exploring innovative trade-to-earn models that make intelligent trading more accessible to everyone. Its 1,000 BTC Protection Fund further strengthens asset safety and transparency, while features such as copy trading and advanced trading tools allow users to follow professional traders and experience a more efficient, intelligent trading journey.
Follow WEEX on social mediaX: @WEEX_Official
Instagram: @WEEX Exchange
Tiktok: @weex_global
Youtube: @WEEX_Official
Discord: WEEX Community
Telegram: WeexGlobal Group

FC Barcelona vs Celta Vigo: Can Anyone Stop Barcelona at Home?
FC Barcelona vs Celta Vigo lineups, standings, and stats for April 22, 2026. FC Barcelona need a win to stay on track for the La Liga title. Full preview inside.
Carl Moon & WEEX Head to Mugello: The Crypto Trader's Ferrari Challenge
Forget the sidelines. WEEX is hitting the 300km/h mark at Mugello this weekend. Witness Carl Moon’s transformation from a supermarket cashier to a Ferrari racer, and discover why the world’s fastest trading floor belongs on the world’s most technical track at the official Ferrari Challenge.

How to Become a Pro Crypto Trader: WEEX Interview with Ferrari Racer Carl Moon
Ferrari racer Carl Moon on mastering crypto trading: 80/20 rule, AI tools, Bitcoin at $95K, and risk lessons from the track.

Morning Report | Amazon increases investment in Anthropic up to $25 billion; SEC plans to introduce an "innovation exemption" mechanism to support compliant on-chain trading of tokenized securities

Jeff Hoffman, founder of Booking.com: How Web3 and AI are reshaping the trillion-dollar social travel market

Top 12 Cryptocurrencies to Invest in April 2026
Key Takeaways: Bitcoin remains the dominant player with a $1.42 trillion market cap. Hyperliquid’s HYPE token gains traction,…
18 Best Crypto & Bitcoin Casinos in March 2026
Key Takeaways: Cryptocurrencies offer faster, cheaper, and more private payment options in online casinos. Top crypto casinos include…

Full Post-Mortem of the KelpDAO Incident: Why Did Aave, Which Was Not Compromised, End Up in Crisis Situation?
Key Takeaways: The KelpDAO incident exposed vulnerabilities in collateral pricing and cross-chain bridge operations, affecting Aave’s liquidity. rsETH…

Is MicroStrategy’s STRC Bitcoin’s Savior or Destroyer?
Key Takeaways: MicroStrategy’s STRC offers an annualized yield of 11.5%, driving significant Bitcoin buying pressure. Michael Saylor’s financial…

Ceasefire Expiration and Market Response: Bitcoin Defies Market Trends
Key Takeaways: The current ceasefire agreement is anticipated to expire on Wednesday in Washington, with low likelihood of…

Oil Price Dilemma: More Than a Price Hike
Key Takeaways: Global oil market has surpassed its breaking point, not solving with price hikes but facing significant…

On the Day Aave Launched rsETH, Spark Strategically Exited
Key Takeaways: Aave enabled rsETH lending at a 93% LTV, while Spark withdrew due to low utilization by…

Nasdaq Breaks Record and Crypto Transactions Surge
Key Takeaways: Nasdaq’s rise to a new intraday high indicates strong market momentum. A significant transfer of 35,000…

Powell: Fed Requires a Brand New Inflation Blueprint
Key Takeaways: Powell aims for transformative policy overhauls within the Fed if appointed. Past inflation response mistakes during…

Without Cook’s Apple, Can it Still Grow in the AI Era?
Key Takeaways: John Ternus acts more like a systematic integrator within Apple rather than a solo visionary. Apple’s…

Iran Stock Market and Crypto Developments in Focus
Key Takeaways: The Iranian stock market is set to reopen in 10 to 12 days, excluding companies impacted…
ZachXBT vs. RAVE: Seeking the Truth Behind Crypto Market Volatility
Key Takeaways: In April 2026, RAVE surged by 4500%, later collapsing 90% after investigations by ZachXBT, Binance, and…
Is XRP a Good Investment in 2026? Why Is It Stuck at $1.45
XRP is up 6.7% this week, but exchange reserves remain high. Is a volatility spike imminent? We analyze price trend, ETF inflows, whale activity, and regulatory catalysts to answer: will XRP go up, why is XRP dropping, and is XRP a good investment right now?
TL; DR
What is XRP: XRP is a digital asset built for fast, low-cost international payments. It runs on the XRP Ledger and is used by Ripple for its On-Demand Liquidity (ODL) service. Unlike Bitcoin, XRP settles transactions in 3-5 seconds with near-zero fees.Why is XRP Dropping: XRP is not actively dropping, but it is struggling to rise. On the monthly chart, XRP has seen six consecutive months of decline. Currently, the price faces an additional supply wall at $1.45. About 1.24 billion XRP were bought in that range, and those holders sell when the price approaches, creating selling pressure that prevents a recovery.Will XRP Go Up: Potentially yes. XRP is trading near $1.43 and showing its best weekly performance since September 2025. If the price breaks above the $1.45 resistance, analysts expect a move toward $1.90, supported by strong institutional demand.Is XRP a Good Investment: The answer is not simple. Short-term traders may see opportunity in the coming volatility spike. Long-term investors face a bigger question that depends on one key regulatory event. However, the data reveals a surprising signal that most retail buyers are missing right now. To understand whether XRP is a smart buy or a trap at $1.43, you will need to read the full analysis below.What is XRP? A Digital Asset for Global SettlementBefore analyzing the charts, it is crucial to understand the asset in question. What is XRP? Unlike Bitcoin, which was designed as a decentralized digital gold, XRP operates on the XRP Ledger (XRPL). It was created to facilitate fast, low-cost international payments. Traditional bank transfers take days and incur high fees. XRP transactions settle in 3-5 seconds, costing fractions of a penny.
Ripple, the company associated with XRP, uses this asset for its "On-Demand Liquidity" (ODL) service. Banks and financial institutions use ODL to source liquidity during cross-border transactions without pre-funding accounts. This utility is the primary driver for institutional interest. Recently, the network hit a milestone of over 8 million active wallets, signaling growing usage despite recent price stagnation . Furthermore, Ripple is proactively preparing for the future, releasing a four-stage roadmap to make the XRPL "quantum-resistant," aiming to secure the ledger against future quantum computing threats by 2028 .
XRP Price Analysis: The Battle for $1.45The XRP price trend over the last month tells a story of exhaustion followed by cautious recovery. On the monthly chart, XRP experienced six consecutive months of decline. However, April shows signs of a bottoming process. Weekly charts reinforce this view: after four weeks of lower closes, the last two weeks have seen small rebounds.
According to data from April 22, 2026, XRP is trading at approximately $1.44. Over the last seven days, XRP has outperformed both Bitcoin and Ethereum, rising 6.7% while the broader market rose only 3.2%. Spot trading volume surged 23% to $3.79 billion, and derivative markets saw $40 billion in futures volume on a single day.
Despite this, the price remains 60% below its July 2025 high of $3.65. The current technical picture shows a "low volatility grind" higher. The 20-day EMA is at $1.3924, and the 50-day EMA is at $1.4119, both acting as support . However, the immediate hurdle is the $1.45 resistance level. This price point has rejected every rally attempt in 2026.
Why is XRP Dropping? And Will XRP Go Up?The primary reason for the recent "drop" (or lack of upward momentum) is not active selling, but rather the "supply wall." Data indicates that roughly 1.24 billion XRP tokens were purchased by investors in the $1.45 to $1.47 range. These investors have been waiting months to "break even." Every time the price approaches $1.45, these holders sell to exit their positions, creating a massive wall that retail buying cannot easily absorb.
However, the underlying momentum is shifting. Analysts suggest a xrp volatility spike imminent because the absorption capacity of buyers is increasing. Historically, when exchange reserves are high but the price refuses to drop significantly, it signals that buyers are absorbing the supply. The price has held above $1.39 despite the overhang, which is a sign of relative strength.
So, will XRP go up? Yes, potentially. But it needs a catalyst, if the price closes a daily candle above $1.45. If that happens, the next targets are $1.60 to $1.65, and eventually $1.90 .
XRP Exchange Netflow and XRP ETF Netflow: A Tale of Two MarketsThe current market dynamic is best understood by looking at two opposing data streams: XRP Exchange netflow and XRP ETF flows.
Exchange Dynamics (Retail / Whales):
Data shows a complex pattern of "large inflows and increasing reserves." Recently, a Ripple-associated wallet moved 75 million XRP (approx. $108 million) to Coinbase. This initially looks like a dump, but context matters. These transfers are likely to provide liquidity for Ripple’s ODL business, not necessarily spot market selling. However, the result is that exchange reserves have climbed to 2.76 billion XRP .
The Good News: While reserves are high, the rate of increase is slowing. Specifically, "whale" transfers to exchanges have dropped 98% from their April 11 peak. The Binance reserve has slightly decreased from 27.7 to 27.6 billion. The aggressive selling from large holders appears to have stopped.
Institutional Dynamics (ETF):
While whales were sending coins to exchanges, institutions were buying XRP ETF products. XRP ETF net flow is strongly positive.
US-listed XRP ETFs recorded four consecutive days of inflows totaling $38.86 million recently .The weekly inflow for mid-April hit $119.6 million, a multi-month high .Cumulative net inflows stand at $12.8 billion, with Assets Under Management (AUM) at roughly $10.8 billion.Analyzing the Divergence: Why Both Flows Are PositiveIt seems contradictory that exchange reserves are high (suggesting selling) while ETFs are buying (suggesting buying). However, this phenomenon reveals the current market structure.
Different Investor Profiles: The exchange inflows likely come from short-term traders, market makers, or Ripple itself providing ODL liquidity. These are "hot" coins ready to be sold. The ETF inflows represent "sticky" capital. Institutions buying ETFs are typically long-term holders (LTHs) or asset managers who do not day-trade. They are removing liquidity from the spot market by buying through custodians.The "De-risking" Trade: Sophisticated funds might be engaging in basis trading. They buy the ETF (taking a long position) while simultaneously shorting XRP futures or selling spot inventory to capture the funding rate. This keeps the price stable while volume increases.Absorption: The most likely scenario is that the market is simply absorbing the excess supply. The fact that the price is stable ($1.43) and not collapsing to $1.20 despite 2.76 billion coins sitting on exchanges is a massive win for the bulls. The ETF inflows are acting as a sponge, soaking up the selling pressure from the ODL wallets.The Regulatory Catalyst: The SEC and the CLARITY ActFundamentally, the recent price action cannot be separated from regulation. For years, the primary answer was the SEC lawsuit. That narrative is dying.
Ripple CEO Brad Garlinghouse recently praised SEC Chair Paul Atkins as "a breath of fresh air and sanity" . This regulatory thaw is critical. The SEC is reportedly considering dropping the long-standing lawsuit, and five XRP ETF applications are awaiting review.
The major catalyst on the horizon is the CLARITY Act. A Senate markup is expected before the end of April. Standard Chartered analysts project that if the bill advances, it could unlock $4 to $8 billion in institutional flows . Polymarket gives the bill a 60-66% chance of passing in 2026. If the CLARITY Act classifies XRP as a non-security (commodity), the institutional floodgates will open, likely overwhelming the $1.45 supply wall instantly.
Is XRP a Good Investment in 2026?Given all this data, is XRP a good investment? The answer depends entirely on your risk tolerance and time horizon.
The Bull Case (Why it is a good investment): The risk/reward ratio is asymmetrical to the upside. The price is near multi-year lows relative to its utility. Whale selling has stopped, ETF demand is rising, and the network is expanding (8 million wallets, quantum resistance roadmap). If the CLARITY Act passes, XRP could realistically trade between $1.60 and $1.80 in the short term, with a potential run to $3.00+ if the lawsuit is officially dropped.The Risk Case (Why it is NOT a good investment): There is a clear resistance wall at $1.45. If the CLARITY Act fails or is delayed past May (due to midterm election dynamics), the "buy the rumor, sell the news" dynamic could reverse. If the price fails to break $1.45 and loses support at $1.33, a drop back to $1.15 is technically possible .Verdict: XRP is a speculative buy for traders looking for a volatility spike. It is a hold for current investors. For new investors, it is only a good investment if you believe in regulatory clarity within the next 30 days. Technically, waiting for a confirmed break above $1.55 (to avoid the fakeout) is safer than buying at $1.43.
FAQQ: Will XRP go up if the CLARITY Act passes?
A: Yes, historically. Analysts predict that if the CLARITY Act passes, signaling that XRP is a commodity, it would remove the regulatory overhang. This could trigger a surge in institutional buying, pushing the price from the current $1.43 range to test the $1.80 - $2.00 resistance levels quickly.
Q: Why is XRP dropping when Bitcoin is going up?
A: XRP has specific supply dynamics. Unlike Bitcoin, which has a fixed supply issuance, XRP faces periodic sell-pressure from Ripple's treasury wallets used to fund ODL (liquidity) services. Additionally, the $1.45 "break-even" wall causes XRP to drop relative to BTC when short-term traders exit.
Q: Is a volatility spike imminent for XRP?
A: Yes. The Bollinger Bands on the daily chart are squeezing. The price is stuck between support at $1.33 and resistance at $1.45. Historically, when XRP volume surges 23% in a week (as it did on April 21), it precedes a violent move. The direction depends on whether the $1.45 resistance breaks.
Q: What is the XRP ETF netflow status?
A: As of late April 2026, XRP ETFs are seeing positive netflows. The US ETFs recorded a single week inflow of $119.6 million in mid-April. Cumulative inflows are strong at $12.8 billion, indicating that institutions are accumulating during this dip, which is a long-term bullish signal for price stabilization.
Q: Is XRP a good investment for beginners?
A: XRP is less volatile than "meme coins" but more volatile than Bitcoin. For beginners, it is a moderate-risk investment. Its value is tied to real utility (bank payments). However, beginners should wait to see if the price can close a weekly candle above $1.55 before entering, to avoid buying into the current resistance wall.
Disclaimer: None of the information in this article constitutes, or is intended to constitute, investment advice. Trading cryptocurrencies carries a high level of risk and may not be suitable for all investors. Always do your own research.
About WEEXFounded in 2018, WEEX has developed into a global crypto exchange with over 6.2 million users across more than 150 countries. The platform emphasizes security, liquidity, and usability, providing over 1,200 spot trading pairs and offering up to 400x leverage in crypto futures trading. In addition to the traditional spot and derivatives markets, WEEX is expanding rapidly in the AI era — delivering real-time AI news, empowering users with AI trading tools, and exploring innovative trade-to-earn models that make intelligent trading more accessible to everyone. Its 1,000 BTC Protection Fund further strengthens asset safety and transparency, while features such as copy trading and advanced trading tools allow users to follow professional traders and experience a more efficient, intelligent trading journey.
Follow WEEX on social mediaX: @WEEX_Official
Instagram: @WEEX Exchange
Tiktok: @weex_global
Youtube: @WEEX_Official
Discord: WEEX Community
Telegram: WeexGlobal Group
FC Barcelona vs Celta Vigo: Can Anyone Stop Barcelona at Home?
FC Barcelona vs Celta Vigo lineups, standings, and stats for April 22, 2026. FC Barcelona need a win to stay on track for the La Liga title. Full preview inside.
Carl Moon & WEEX Head to Mugello: The Crypto Trader's Ferrari Challenge
Forget the sidelines. WEEX is hitting the 300km/h mark at Mugello this weekend. Witness Carl Moon’s transformation from a supermarket cashier to a Ferrari racer, and discover why the world’s fastest trading floor belongs on the world’s most technical track at the official Ferrari Challenge.
How to Become a Pro Crypto Trader: WEEX Interview with Ferrari Racer Carl Moon
Ferrari racer Carl Moon on mastering crypto trading: 80/20 rule, AI tools, Bitcoin at $95K, and risk lessons from the track.
